INFORMATION DESIGN // PROJECT 1: INSTRUCTABLE POSTER
28/10/2022–02/12/2022 / Week 9–Week 14
Hasnol Rafiq Bin Hasnol Raduan / 0356767
Information Design / Bachelor of Design (Hons) in Creative Media / Taylor's
Design School
INSTRUCTIONS
PROJECT 1: INSTRUCTABLE POSTER
I chose this Pizza recipe because I thought it was simple but detailed enough
to create a good infographic.
There are several steps involved in creating a layout for an infographic. To
begin, I needed to identify the key information and data that would be
included in the infographic, such as the ingredients and cooking process. Then
I can start sketching out a layout options, experimenting with different text,
image, and icon arrangements. To make the infographic visually appealing and
easy to understand, keep the target audience in mind and use appropriate
fonts, colors, and graphics. Once a layout has been selected, I can refine the
design to ensure that the information is presented in a logical and engaging
manner.
Due to the fact that the infographic requires a significant amount of
information to be compressed into concise language, I attempted to
streamline the recipe as much as possible while maintaining its
authenticity.
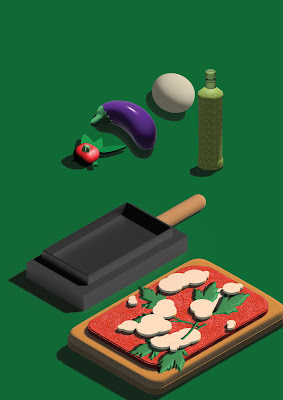
Following the creation of a sketch, I began working on the individual assets
that would comprise the infographic in Adobe Illustrator. I decided to make
them 3D because it can improve the overall visual appeal of an infographic and
provide a more engaging experience for the viewer. 3D elements can help
highlight important information and draw attention to specific sections of the
graphic by adding depth and dimension to the design. Furthermore, 3D elements
can make the infographic feel more realistic and interactive, creating a sense
of immersion and allowing the viewer to explore the information in a more
dynamic manner. Overall, incorporating 3D elements into an infographic can
help elevate the design and create a stronger visual message.

|
In Illustrator, I began work on the final poster. After receiving feedback, I began by changing some of the text and image positioning. When I changed the text, I had to make a number of changes, such as clarifying language, making the text more concise, and making it more visually appealing. Adjusting the image placement required me to reposition them on the page in order to make the infographic more appealing.
After it was completed, I began working on the motion graphic in After Effects. I started by simply moving the position property of my elements across the screen to create the illusion of motion. Similarly, changing the scale property causes an array of elements to appear on the screen, adding another level of visual interest. I wanted to choose something appropriate for the background music, so I chose That's Amore by Dean Martin because it is an Italian song about cooking pizza for their love, which reminds me of Giacanda and Bartolo.
Feedback
Reflection
The process of creating an infographic entails careful planning and research,
which can aid in the development of visual communication and design thinking
skills. It has aided in the development of design skills by encouraging
creativity and innovation. Color, typography, and layout are just a few of the
design elements to think about. Experimenting with different elements and
combining them in novel ways can aid in the development of creative
problem-solving abilities. I've also worked on improving my visual
communication skills. Infographics are a powerful tool for communicating
complex information in a visually appealing and easy-to-understand format. It
is possible to develop skills in presenting information in a clear and concise
manner, using visual aids to enhance understanding, by creating an infographic
on a pizza recipe.

.jpg)

Comments
Post a Comment